WSLが重かったので掃除

WSL立ち上げるとPCが重い。メモリも6GBくらい食っていた。まともにPC使えないので掃除した。

psコマンドでリソース食っている原因を確認。k8sがソース食っていた。そういえば昔入れたな。。

    PID USER      PR  NI    VIRT    RES    SHR S  %CPU  %MEM     TIME+ COMMAND                                                                                  
   2337 root      20   0 3107080 663908 105088 S 113.1   8.2  13:38.90 kubelite                                                                                 
   1509 hayashi   20   0   62.4g 662388  58496 S  22.0   8.2   5:29.46 node                                                                                     
   6375 root      20   0 1780156  47232  32000 S  19.0   0.6   1:59.35 calico-node                                                                              
    113 root      20   0  526812   7276   1408 S  12.1   0.1   0:47.59 snapfuse

こんな感じで掃除するとそこそこ軽くなった。

$ sudo snap remove microk8s ubuntu-desktop-installer gtk-common-themes
$ sudo apt purge *k8s*
$ sudo apt autoremove

WebSocketの使い方メモ

WebSocketの使い方メモ

サーバ
const WebSocket = require("ws");
// サーバを作成
const wss = new WebSocket.Server({ port: PORT });
// 接続時の処理
wss.on("connection", (ws) => {
  let id = clientIdCounter++;
  const client = {
    ws,
    name: "Anonymous",
    roomId: null,
    userId: id,
  };
  // クライアントを保持しておく(必須ではない)
  clients.set(ws, client);

  // クライアントに自分のIDを返却
  client.ws.send(
    JSON.stringify({
      type: "yourId",
      id: client.userId,
    })
  );
  // ここにメッセージ受信した際の処理を書いておく
  ws.on("message", (message) => {
  ...
  }
クライアント
      // IPアドレスとポート指定してWebSocketを作成
      ws = new WebSocket("ws://" + ip.value)
      // Openした際の処理
      ws.onopen = () => {
        ws.send(JSON.stringify({ type: "getRooms" }))
      }
      // サーバからメッセージを受信した際の処理
      ws.onmessage = (e) => {
        const msg = JSON.parse(e.data)
        logger(log_mp, "Recv: " + msg.type);

        if (msg.type === "yourId") {
          myUserId = msg.id
          logger_add(log_mp, "Your ID: " + myUserId);
        }
    }
      // メッセージ送信処理。WebSocketがOpenしているか確認してから送信
      if (ws && ws.readyState === WebSocket.OPEN) {
        ws.send(JSON.stringify({
          type: "joinRoom",

VSCode拡張機能をデプロイしようとしたらやけに大きくなる時

.vscodeignoreがないのが原因。中身は以下のような感じ。

# .vscodeignore

**/*.ts
**/*.map
**/.gitignore
**/tsconfig.json
**/webpack.config.js
**/vsc-extension-quickstart.md
**/changelog.md
**/node_modules/**
!node_modules/vscode-languageclient/**   # 必要なら例外で残す
!node_modules/vscode-jsonrpc/**

Pythonのプロセス間通信

Pythonでマルチプロセス通信を行う場合はmultiprocessingのManagerやQueueを使用すると便利。Managerは共有の変数、Queueはトリガーとして使用できる。

import multiprocessing
import time


class Device:
    def __init__(self, shared_state, command_queue):
        self.shared_state = shared_state  # 状態共有用
        self.command_queue = command_queue  # コマンド受信用
        self.running = True

    def run(self):
        counter = 0
        while self.running:
            # コマンド受信チェック(非ブロッキング)
            try:
                cmd = self.command_queue.get_nowait()
                if cmd == "reset":
                    print("[Device] Reset command received")
                    counter = 0
                elif cmd == "stop":
                    print("[Device] Stop command received")
                    self.running = False
            except Exception:
                pass

            # 状態更新
            counter += 1
            self.shared_state["device_status"] = f"running: {counter}"
            time.sleep(1)


class Main:
    def __init__(self, shared_state, command_queue):
        self.shared_state = shared_state
        self.command_queue = command_queue

    def run(self):
        for i in range(8):
            state = self.shared_state.get("device_status", "unknown")
            print(f"[Main] Device state: {state}")

            # 3秒後にresetコマンド送信
            if i == 3:
                print("[Main] Sending reset command")
                self.command_queue.put("reset")

            time.sleep(1)


if __name__ == "__main__":
    manager = multiprocessing.Manager()
    shared_state = manager.dict()
    command_queue = multiprocessing.Queue()

    # Deviceプロセス起動
    device = Device(shared_state, command_queue)
    device_process = multiprocessing.Process(target=device.run)
    device_process.start()

    try:
        main = Main(shared_state, command_queue)
        main.run()
    finally:
        # 停止コマンド送信
        command_queue.put("stop")
        device_process.join()
        print("Stopped Device process.")

Pythonでノイズ検出方法を考える

想定するノイズは、バッファアンダーランのようなノイズ。 検証対象としてはノイズ検出しやすそうな穏やかな曲調のカノン。以下からダウンロード。

classical-sound.seesaa.net

以下のスクリプトで、バッファアンダーランを想定して一部バッファを削除してノイズを想定した音源を作成。

import numpy as np
import librosa
import soundfile as sf
import random

def inject_audio_dropouts(input_path, output_path, num_dropouts=5, dropout_ms=50, dropout_interval_ms=500, random_drop=False, remove=False):
    y, sr = librosa.load(input_path, sr=None, mono=True)
    samples_per_drop = int(sr * (dropout_ms / 1000.0))
    print(f"Loaded audio file: {input_path} with sample rate: {sr} Hz samples_per_drop: {samples_per_drop}")
    if random_drop:
        for i in range(num_dropouts):
            start = random.randint(0, len(y) - samples_per_drop)
            if remove:
                # サンプル削除(欠落)
                y = np.concatenate([y[:start], y[start+samples_per_drop:]])
            else:
                # 無音化
                y[start:start+samples_per_drop] = 0
            print(f"\rDropout {i+1}/{num_dropouts} at sample {start}", end='')
    else:
        for i in range(num_dropouts):
            start = i * int(sr * (dropout_interval_ms / 1000.0))
            if start + samples_per_drop > len(y):
                break
            if remove:
                # サンプル削除(欠落)
                y = np.concatenate([y[:start], y[start+samples_per_drop:]])
            else:
                # 無音化
                y[start:start+samples_per_drop] = 0
            print(f"\rDropout {i+1}/{num_dropouts} at sample {start}", end='')

    sf.write(output_path, y, sr)

# 使用例
inject_audio_dropouts("Canon.wav", "Canon_with_dropouts.wav", num_dropouts=10000, dropout_ms=40, dropout_interval_ms=200, random_drop=False, remove=True)

ノイズ検出は以下のコードで行う。スペクトル変化量でノイズ検出する。

import librosa
import numpy as np
import plotly.graph_objects as go
import os

def detect_noise_offline(
    input_file,
    spectral_threshold=0.02,
    frame_length=1024,
    hop_length=512
):
    """
    WAV/音声ファイルを読み込み、スペクトル変化量でノイズ検出し、
    PlotlyでHTMLグラフを保存する。

    Parameters
    ----------
    input_file : str
        入力音声ファイル(wavなど)
    spectral_threshold : float
        スペクトル変化量の絶対値閾値
    frame_length : int
        STFTのフレーム長
    hop_length : int
        STFTのホップ長
    """

    # ==== 音声読み込み ====
    y, sr = librosa.load(input_file, sr=None, mono=True)

    # ==== STFT ====
    S = np.abs(librosa.stft(y, n_fft=frame_length, hop_length=hop_length))

    # ==== フレーム間のスペクトル差分 ====
    diffs = []
    for i in range(1, S.shape[1]):
        diff_val = np.mean(np.abs(S[:, i] - S[:, i - 1]))
        diffs.append(diff_val)

    times = librosa.frames_to_time(np.arange(1, S.shape[1]), sr=sr, hop_length=hop_length)

    # ==== ノイズ検出 ====
    detections = [t for t, d in zip(times, diffs) if d > spectral_threshold]

    # ==== Plotly グラフ作成 ====
    fig = go.Figure()

    # スペクトル変化量
    fig.add_trace(go.Scatter(
        x=times,
        y=diffs,
        mode='lines',
        name='Spectral Change'
    ))

    # 閾値線
    fig.add_trace(go.Scatter(
        x=[times[0], times[-1]],
        y=[spectral_threshold, spectral_threshold],
        mode='lines',
        line=dict(color='red', dash='dash'),
        name='Threshold'
    ))

    # 検出ポイント
    fig.add_trace(go.Scatter(
        x=detections,
        y=[spectral_threshold] * len(detections),
        mode='markers',
        marker=dict(color='orange', size=8, symbol='x'),
        name='Detected Noise'
    ))

    fig.update_layout(
        title=f"Spectral Change and Noise Detection - {os.path.basename(input_file)}",
        xaxis_title="Time (s)",
        yaxis_title="Spectral Difference (abs)",
        template="plotly_white"
    )

    # ==== HTML保存 ====
    output_html = os.path.splitext(input_file)[0] + ".html"
    fig.write_html(output_html)

    # ==== ログ出力 ====
    for det_time in detections:
        print(f"Detect! {det_time:.3f}s")

    print(f"✅ グラフを保存しました: {output_html}")

    return detections


# ==== 使用例 ====
# detect_noise_offline("Canon.wav", spectral_threshold=0.02)

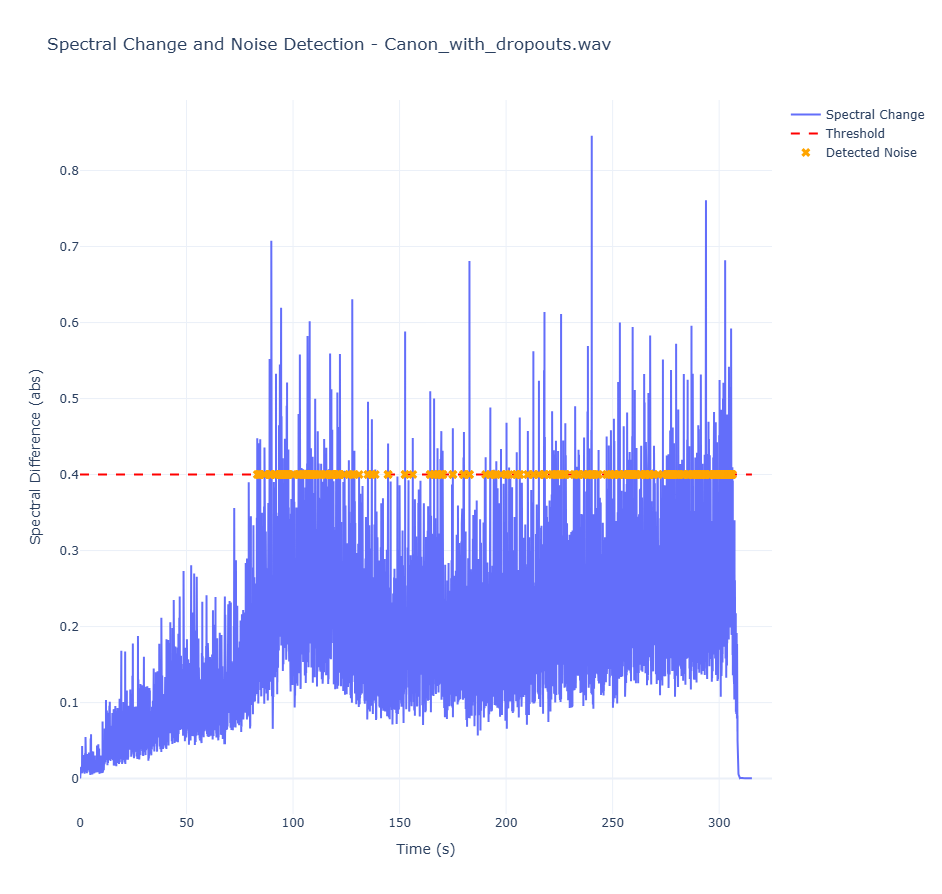
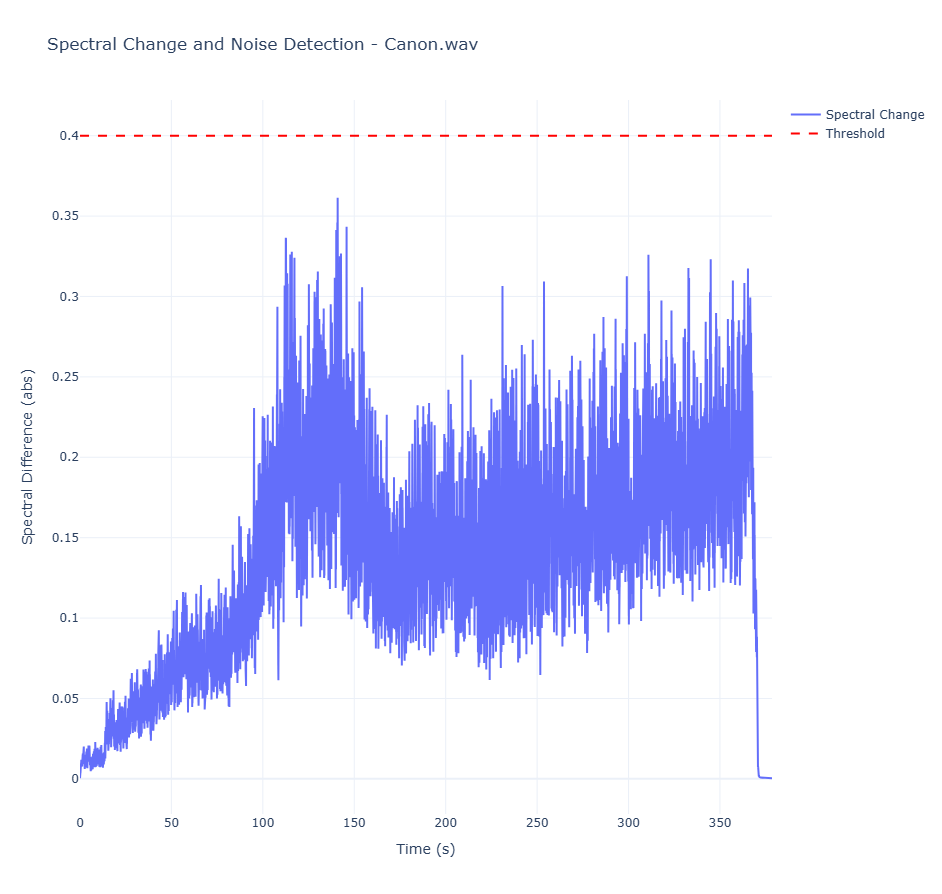
ノイズ有無でのグラフの比較は以下のとおり。ノイズありのほうが値が大きくなっており、0.4あたりを閾値にすればノイズ検出できそう。
ノイズなし オリジナルの音源

ノイズあり

リアルタイムで検出する場合は以下。

import sounddevice as sd
import numpy as np
import librosa
import time
import sys

# ==== 設定 ====
DEVICE_ID = 1       # Noneでデフォルトマイク, またはデバイス番号
FRAME_DURATION = 0.05  # 秒
SPECTRAL_THRESHOLD = 0.13  # ← 絶対値で設定(例: 0.02)
FRAME_LENGTH = 1024
HOP_LENGTH = 512

prev_spec = None

def audio_callback(indata, frames, time_info, status):
    global prev_spec

    if status:
        print(status, file=sys.stderr)

    # モノラル化
    y = indata[:, 0]

    # STFT
    S = np.abs(librosa.stft(y, n_fft=FRAME_LENGTH, hop_length=HOP_LENGTH))

    if prev_spec is not None:
        diff = np.mean(np.abs(S - prev_spec))

        # バー表示
        bar = "#" * int(diff * 100)
        sys.stdout.write(f"\r[{bar:<50}] {diff:.4f}")
        sys.stdout.flush()

        # 閾値判定(絶対値)
        if diff > SPECTRAL_THRESHOLD:
            print(f"\nDetect! {time.strftime('%H:%M:%S')} diff={diff:.4f}")

    prev_spec = S

def main():
    print(f"録音開始 (閾値={SPECTRAL_THRESHOLD}, Ctrl+Cで終了)")
    with sd.InputStream(
        device=DEVICE_ID,
        channels=1,
        callback=audio_callback,
        samplerate=44100,
        blocksize=int(44100 * FRAME_DURATION)
    ):
        while True:
            time.sleep(0.1)

if __name__ == "__main__":
    try:
        main()
    except KeyboardInterrupt:
        print("\n終了")

Pyvisで木構造を可視化(サンプル)


Panel+pyvisで木構造可視化

Panel+pyvisで木構造を可視化する。ほしいのは以下の機能。 - 木構造が表現できること。ノードとエッジが表現でき、矢印で方向を表現できること。 - 分析がしやすいこと。ノードの色や大きさで重要な箇所がわかりやすくできること。あるノードを選択した際に、そこまでのルートが一目でわかること。

起動方法

panel serve dashboard.py --static-dirs assets=./assets

コード

「あるノードを選択した際に、そこまでのルートが一目でわかること」についてはPyvisの元の機能にはなさそうであったため、出力後のHTMLにJSコードを埋め込むことで対応した。

実際にどんなグラフが出てくるかは以下を参照。

wooolwoool.hatenablog.com

import json, re
import panel as pn
from pyvis.network import Network
# from bokeh.models.widgets import DataTable, TableColumn, StringFormatter
import pandas as pd
import os

pn.extension()
old_graph_html_path = None
html_num = 0
result_hist = []


def build_pyvis_graph(tree_data):
    net = Network(height="600px", width="100%", directed=True)
    net.set_options("""
    {
    "nodes": {
        "shape": "dot",
        "font": {
        "size": 14,
        "face": "Tahoma"
        }
    },
    "edges": {
        "arrows": {
        "to": {
            "enabled": true
        }
        },
        "smooth": {
        "enabled": true,
        "type": "cubicBezier"
        }
    },
    "interaction": {
        "navigationButtons": true,
        "keyboard": true
    },
    "physics": {
        "enabled": false
    }
    }
    """)

    # 値の最大・最小を見つける(正規化のため)
    all_vals = []

    def collect_vals(node_data):
        if 'val' in node_data:
            all_vals.append(node_data['val'])
        for child in node_data.get('child', {}).values():
            collect_vals(child)

    for root_data in tree_data.values():
        collect_vals(root_data)

    min_val = min(all_vals) if all_vals else 0
    max_val = max(all_vals) if all_vals else 1
    val_range = max_val - min_val if max_val != min_val else 1

    # RGBグラデーション
    def get_color(val):
        ratio = (val - min_val) / val_range
        # ratio: 0.0 (薄い) → 1.0 (濃い)
        # 濃いCyan: rgb(0, 200, 200)
        # 薄いCyan: rgb(240, 255, 255)

        r = int(240 * (1 - ratio))        # 減らす → 0
        g = int(255 * (1 - 0.2 * ratio))  # 少しだけ暗く → 200
        b = int(255 * (1 - 0.2 * ratio))  # 同上

        return f"rgb({r},{g},{b})"

    def add_nodes(node_name, node_data, path=[]):
        val = node_data.get('val', 0)
        size = 15 + (val - min_val) / val_range * 20  # サイズ調整
        color = get_color(val)

        net.add_node(node_name, label=f"{node_name}\nval={val}", size=size, color=color)
        for child_name, child_data in node_data.get("child", {}).items():
            # child_val = child_data.get('val', 0)
            # width = 1 + (child_val - min_val) / val_range * 5  # エッジ太さ

            # まず子ノードを追加
            add_nodes(child_name, child_data, path + [node_name])

            # ノード追加後にエッジを追加(← ここが重要)
            # net.add_edge(node_name, child_name, width=width)
            net.add_edge(node_name, child_name, width=1)

    for root_name, root_data in tree_data.items():
        add_nodes(root_name, root_data)
    global html_num
    tmp_html_path = f"assets/graph{str(html_num)}.html"
    html_num += 1
    net.save_graph(tmp_html_path)


    # クリック時に親方向のルートを赤くするJS
    custom_js = """
    <script type="text/javascript">
    function highlightPath(network) {
        network.on("click", function (params) {
            const edges = network.body.data.edges;
            edges.update(edges.get().map(e => ({
                ...e,
                color: undefined,
                width: e.originalWidth || e.width
            })));

            if (params.nodes.length === 0) return;
            let target = params.nodes[0];

            while (true) {
                let incoming = edges.get().filter(e => e.to === target);
                if (incoming.length === 0) break;
                let parentEdge = incoming[0];
                parentEdge.originalWidth = parentEdge.width;
                // parentEdge.color = "red";
                parentEdge.width = 5;
                edges.update(parentEdge);
                target = parentEdge.from;
            }
        });
    }

    // ネットワークが準備できたら highlightPath を実行
    if (typeof network !== 'undefined') {
        highlightPath(network);
    } else {
        setTimeout(() => {
            if (typeof network !== 'undefined') highlightPath(network);
        }, 500);
    }
    </script>
    """

    # HTMLファイルにスクリプトを埋め込む
    with open(tmp_html_path, 'r', encoding='utf-8') as f:
        html = f.read()

    html = re.sub(r'</body>', custom_js + '</body>', html, flags=re.IGNORECASE)

    with open(tmp_html_path, 'w', encoding='utf-8') as f:
        f.write(html)
    return tmp_html_path

# グラフとテーブルの初期要素
graph_pane = pn.pane.HTML("<b>Submitしてグラフを表示</b>", height=420, sizing_mode="stretch_width")
result_table = pn.widgets.DataFrame(pd.DataFrame(columns=["Step", "Node", "Success"]), height=200, disabled=True)

# 入力フォーム
json_input = pn.widgets.TextAreaInput(placeholder="JSONを入力", height=150, sizing_mode="stretch_width")
submit_button = pn.widgets.Button(name="Submit", button_type="primary")
sample_submit_button = pn.widgets.Button(name="Sample", button_type="primary")

# Submitボタンクリック時の動作
def process_input(event):
    # try:
        print("Processing input...")
        graph_pane.object = "<b>Processing input...</b>"
        pn.state.cache.clear()
        os.makedirs("assets", exist_ok=True)
        global old_graph_html_path
        if old_graph_html_path and os.path.exists(old_graph_html_path):
            os.remove(old_graph_html_path)
        data = json.loads(json_input.value)
        tree = data["tree"]
        result = data["result"]

        # ノードグラフ更新
        graph_html_path = build_pyvis_graph(tree)
        graph_pane.object = f"""
            <iframe src="/assets/{os.path.basename(graph_html_path)}" width="100%" height="400px" frameborder="0"></iframe>
        """

        # テーブル更新
        result_hist.append(result)
        if len(result_hist) > 10:
            result_hist.pop(0)
        result_df = pd.DataFrame(result_hist, columns=["Step", "Node", "Success"])
        result_table.value = result_df
        old_graph_html_path = graph_html_path

    # except Exception as e:
    #     graph_pane.object = f"<pre>Error: {e}</pre>"

def process_sample_input(event):
    # ランダムなJSONを生成して入力欄にセット
    sample_data = {
        "tree": {
            "root": {
                "val": 10,
                "child": {
                    "child1": {"val": 5, "child": {
                        "grandchild1": {"val": 3, "child": {
                            "greatgrandchild1": {"val": 8, "child": {
                                "greatgreatgrandchild2": {"val": 6, "child": {}}
                            }},
                            "greatgrandchild": {"val": 4, "child": {}}
                        }},
                        "grandchild2": {"val": 2, "child": {
                            "greatgrandchild2": {"val": 1, "child": {}}
                        }}
                    }},
                    "child2": {"val": 15, "child": {
                        "grandchild3": {"val": 8, "child": {
                            "greatgrandchild4": {"val": 7, "child": {}},
                            "greatgrandchild5": {"val": 9, "child": {}}
                        }},
                        "grandchild4": {"val": 6, "child": {}}
                    }}
                }
            }
        },
        "result": [
            {"Step": 1, "Node": "root", "Success": True},
            {"Step": 2, "Node": "child1", "Success": False},
            {"Step": 3, "Node": "child2", "Success": True}
        ]
    }
    json_input.value = json.dumps(sample_data, indent=4)
    process_input(event)

submit_button.on_click(process_input)
sample_submit_button.on_click(process_sample_input)

# レイアウト
layout = pn.Row(
    pn.Column(
        pn.pane.Markdown("## ゲーム検証結果可視化"),
        json_input,
        pn.Row(
            submit_button,
            sample_submit_button,
        )
    ),
    pn.Column(
        pn.pane.Markdown("### ノードグラフ"),
        graph_pane,
        pn.pane.Markdown("### 結果テーブル"),
        result_table,
        sizing_mode="stretch_width"
    )
)

layout.servable()

入力するデータ

{
  "tree": {
    "Start": {
      "child": {
        "AA": {
          "child": {
                "AA12": {
                  "child": {},
                  "val": 13
                },
                "AA22": {
                  "child": {},
                  "val": 15
                }
              },
          "val": 10
        },
        "BB": {
          "child": {},
          "val": 20
        }
      },
      "val": 11
    }
  },
  "result": ["Start", "AA", false]
}